Visual Analytics Project
Group 30
Md Istain Ahmed
Emon Basher
Samiul Islam Sami
TOPIC: T1 Postcards
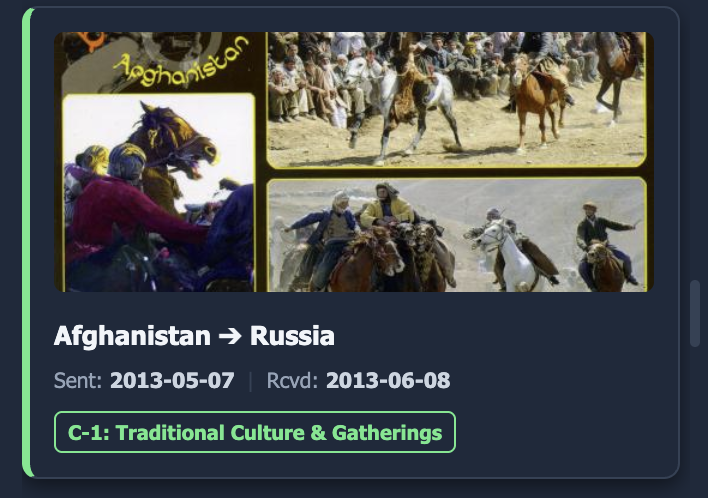
REQUIREMENTS: M1, M2, M3, E1, E2, E3M1: Interactive List View
- Approach: Virtual rendering keeps the browser extremely fast when loading all 10,600+ cards.
- Unique Solution: The left border of each card dynamically matches its exact cluster color.
- Analysis Task: Instantly calculates and displays the delivery duration on every single card.
The Backend: ML Pipeline
How we grouped 10,600+ unstructured images using Artificial Intelligence.
1. AI Vision (CLIP): Used OpenAI's CLIP model to understand the actual meaning of the images, not just basic pixels.
2. Data Cleaning: Applied PCA and L2 Normalization to remove noise and prepare the data for Cosine Similarity.
3. 2D Mapping (SOM): Used a Self-Organizing Map with 100,000 iterations to place similar images right next to each other.
4. Clustering (K-Means): Ran K-Means on the map to perfectly divide the images into exactly 50 groups.
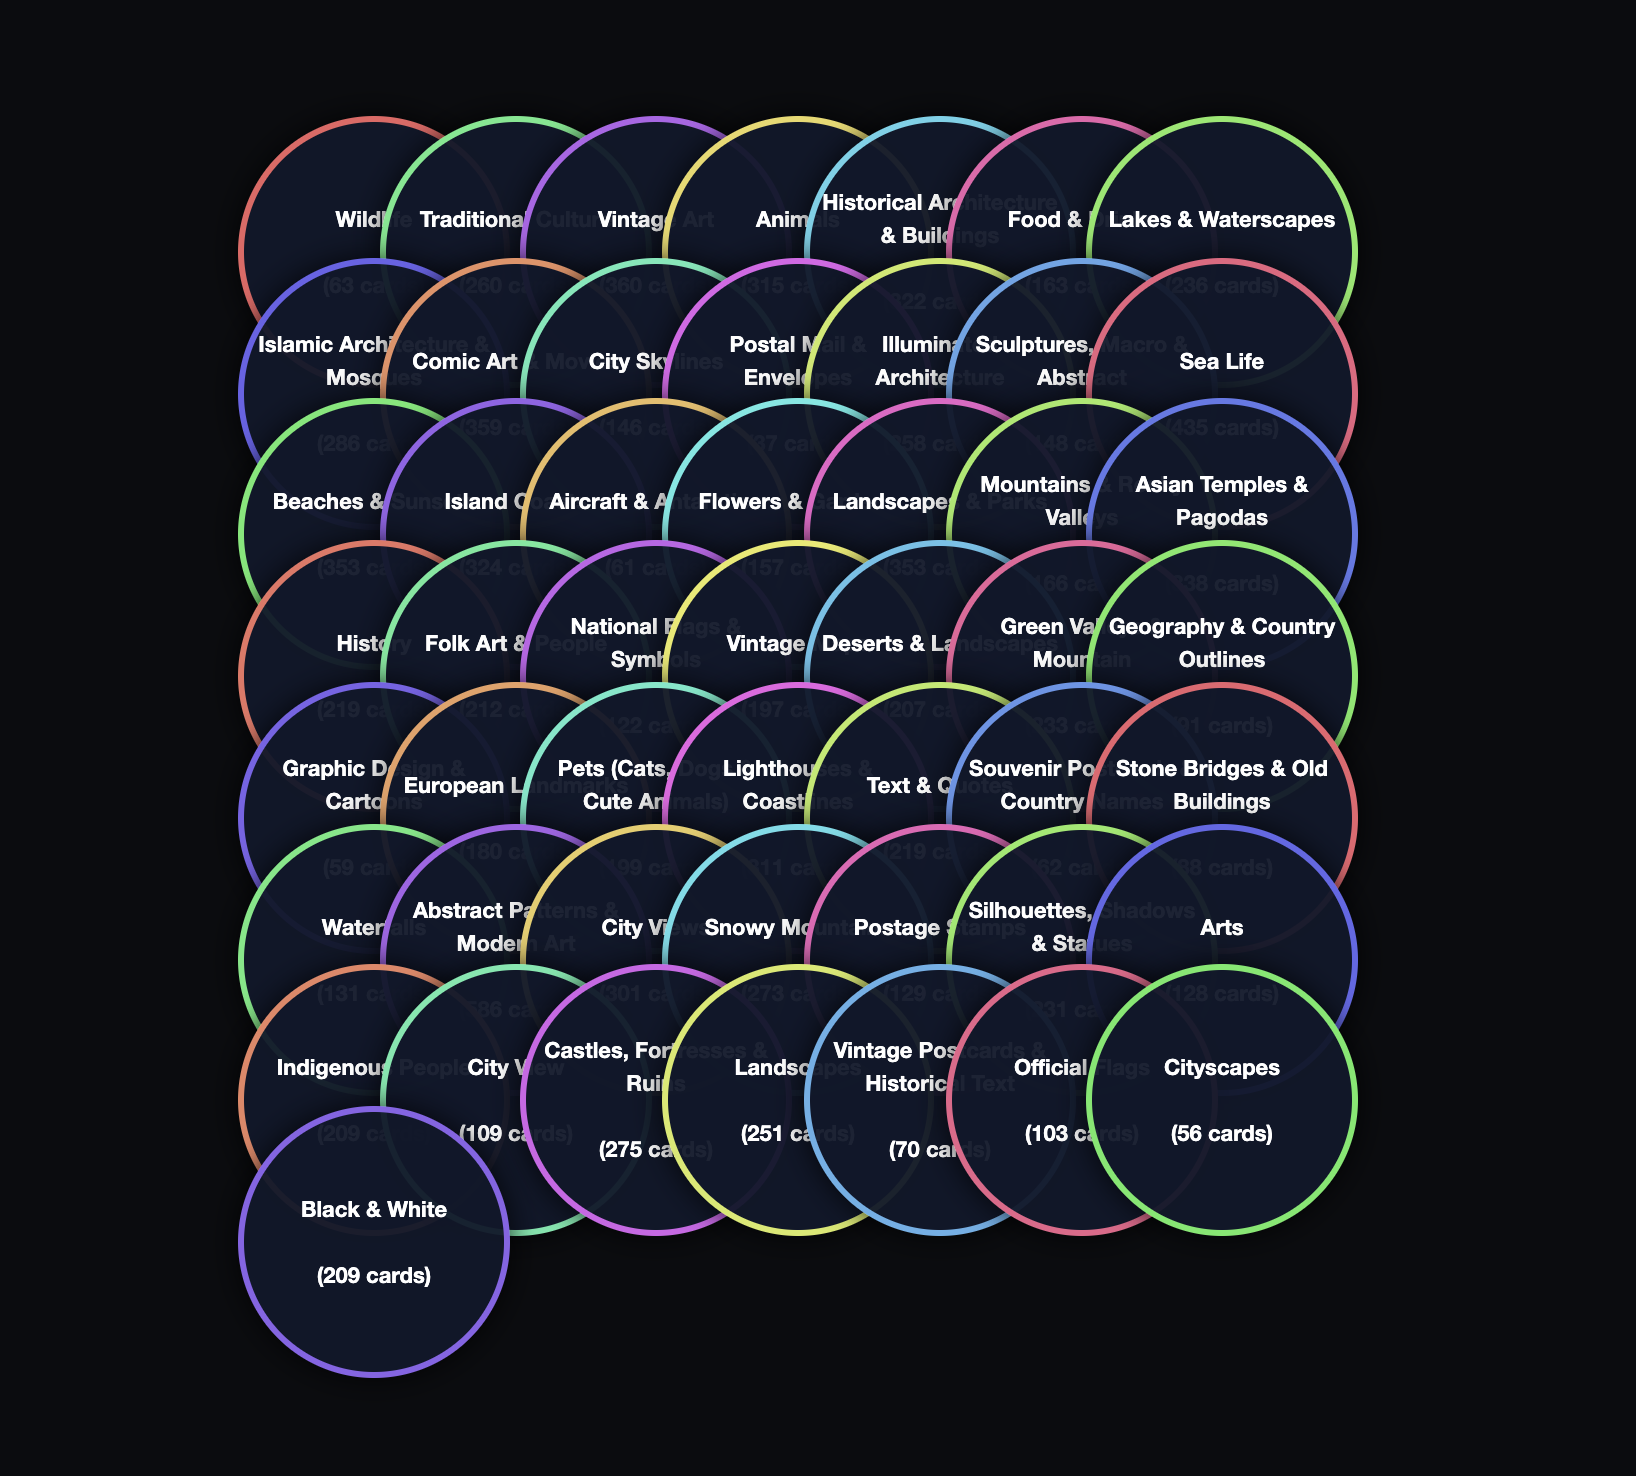
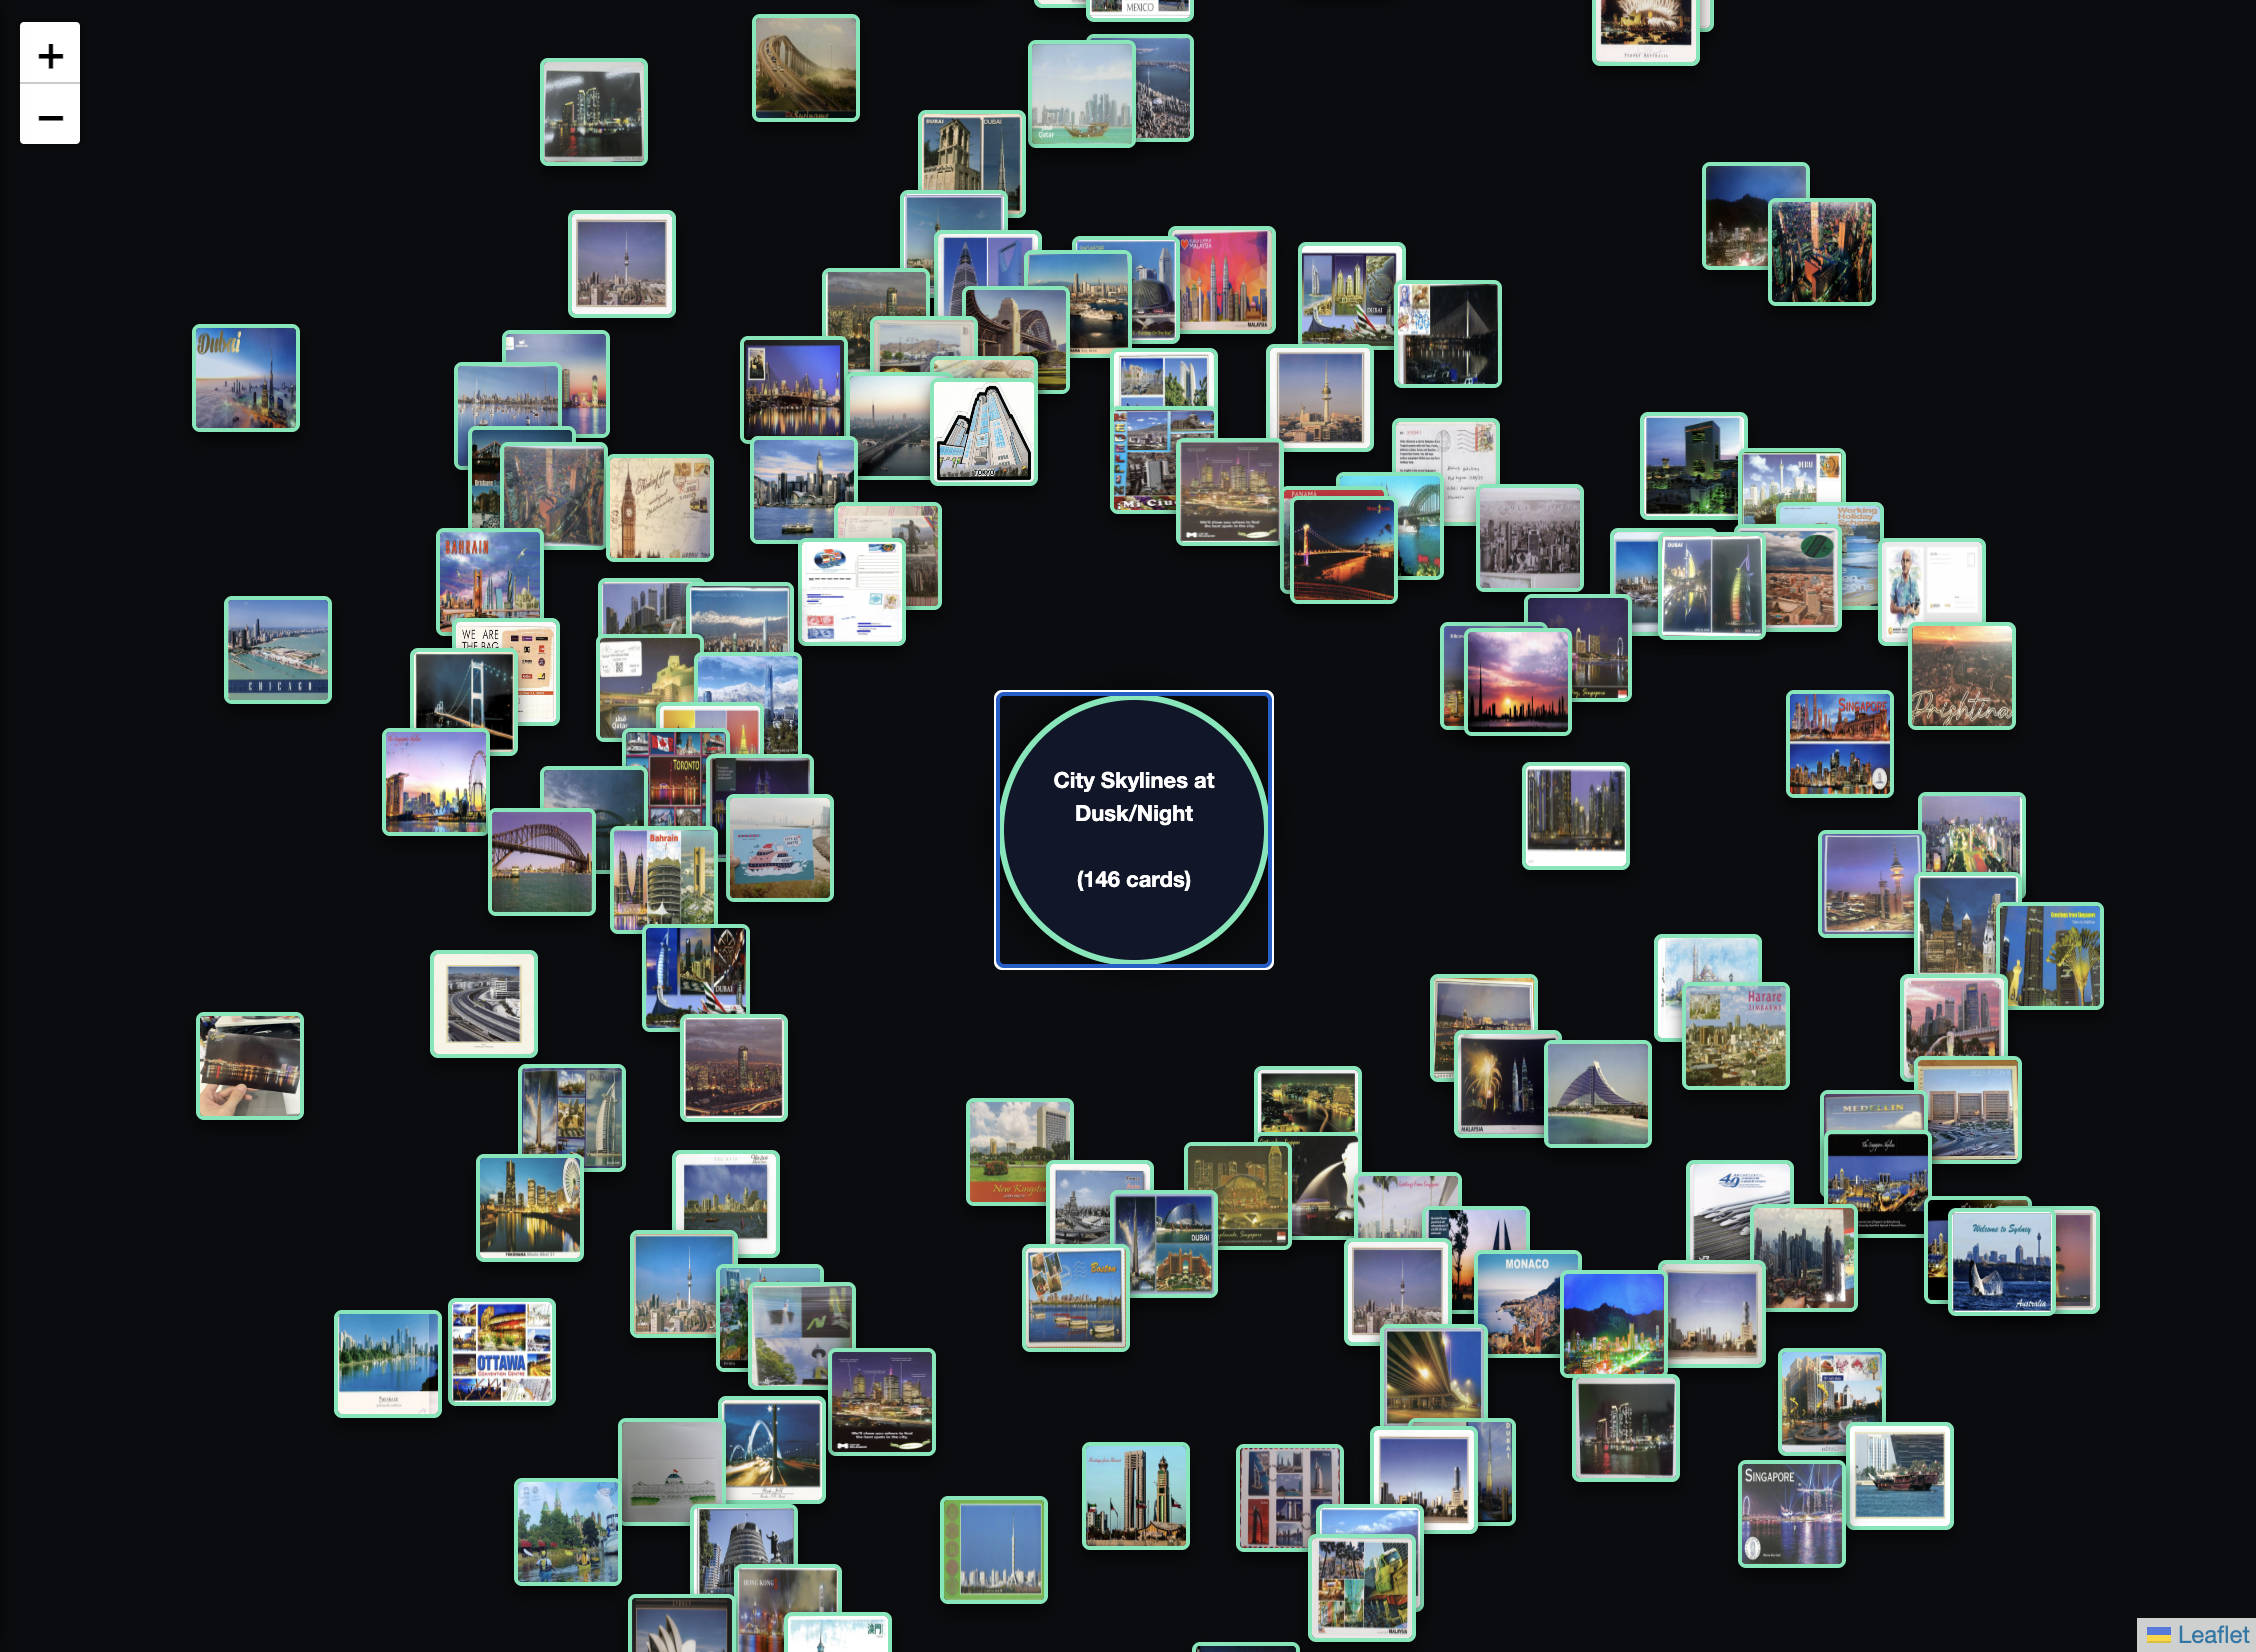
M2: Semantic Cluster Space
- The Challenge: Our unsupervised AI successfully created 50 accurate clusters, but they lacked human-readable names.
- Unique Solution (Human-in-the-loop): We manually inspected the folders to assign real semantic labels like "Wildlife" or "Vintage Maps".
- Analysis Task: Exploring and filtering themes across thousands of images very easily.
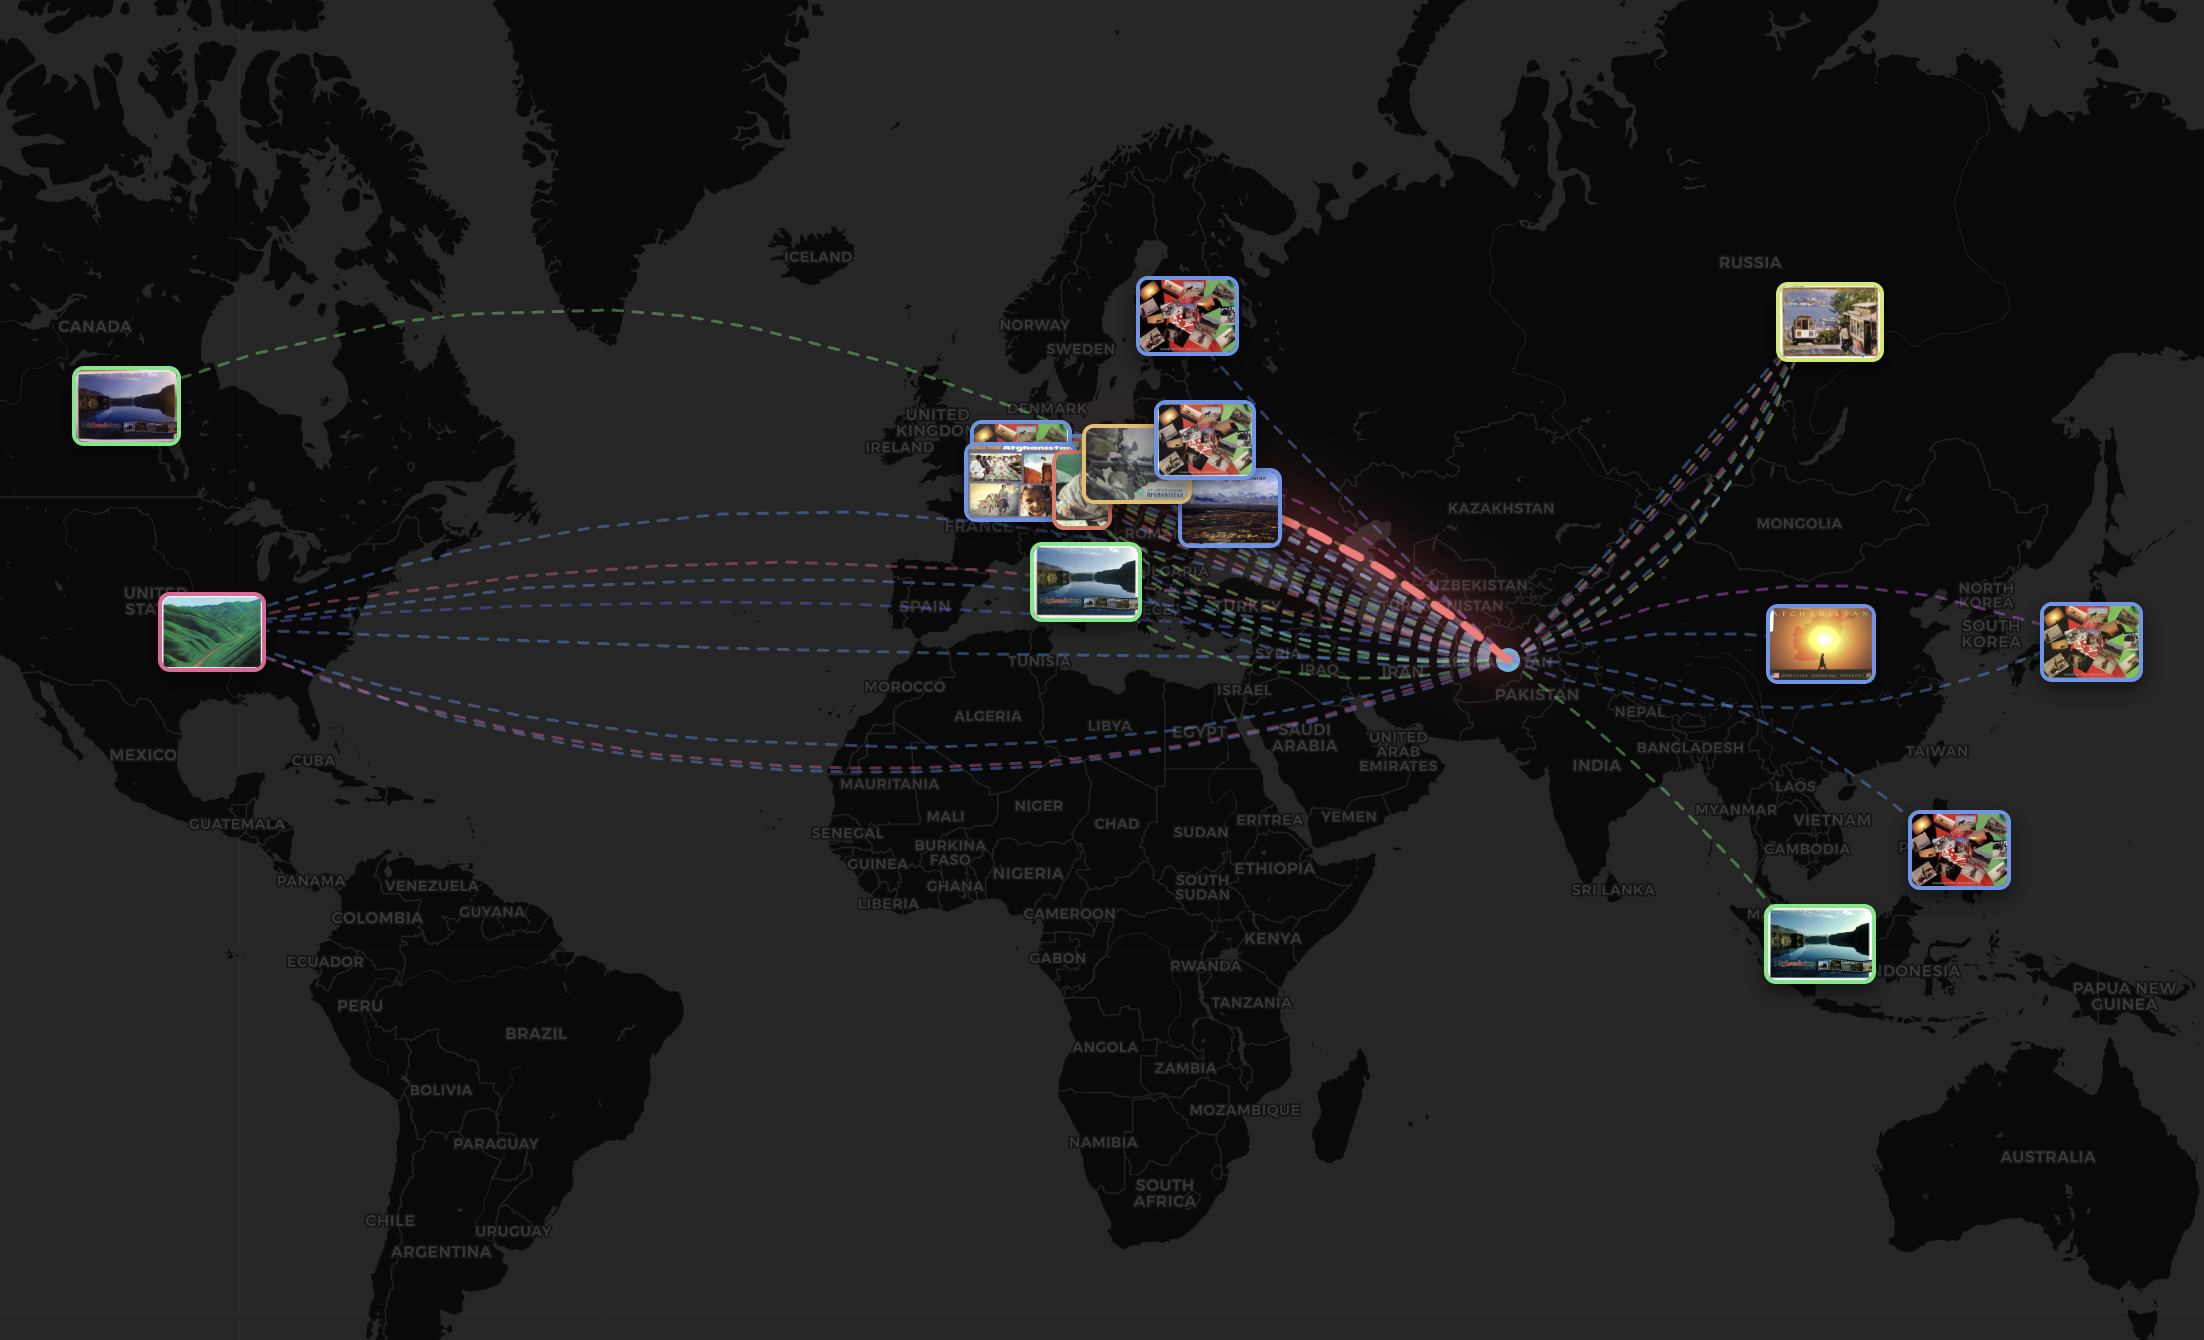
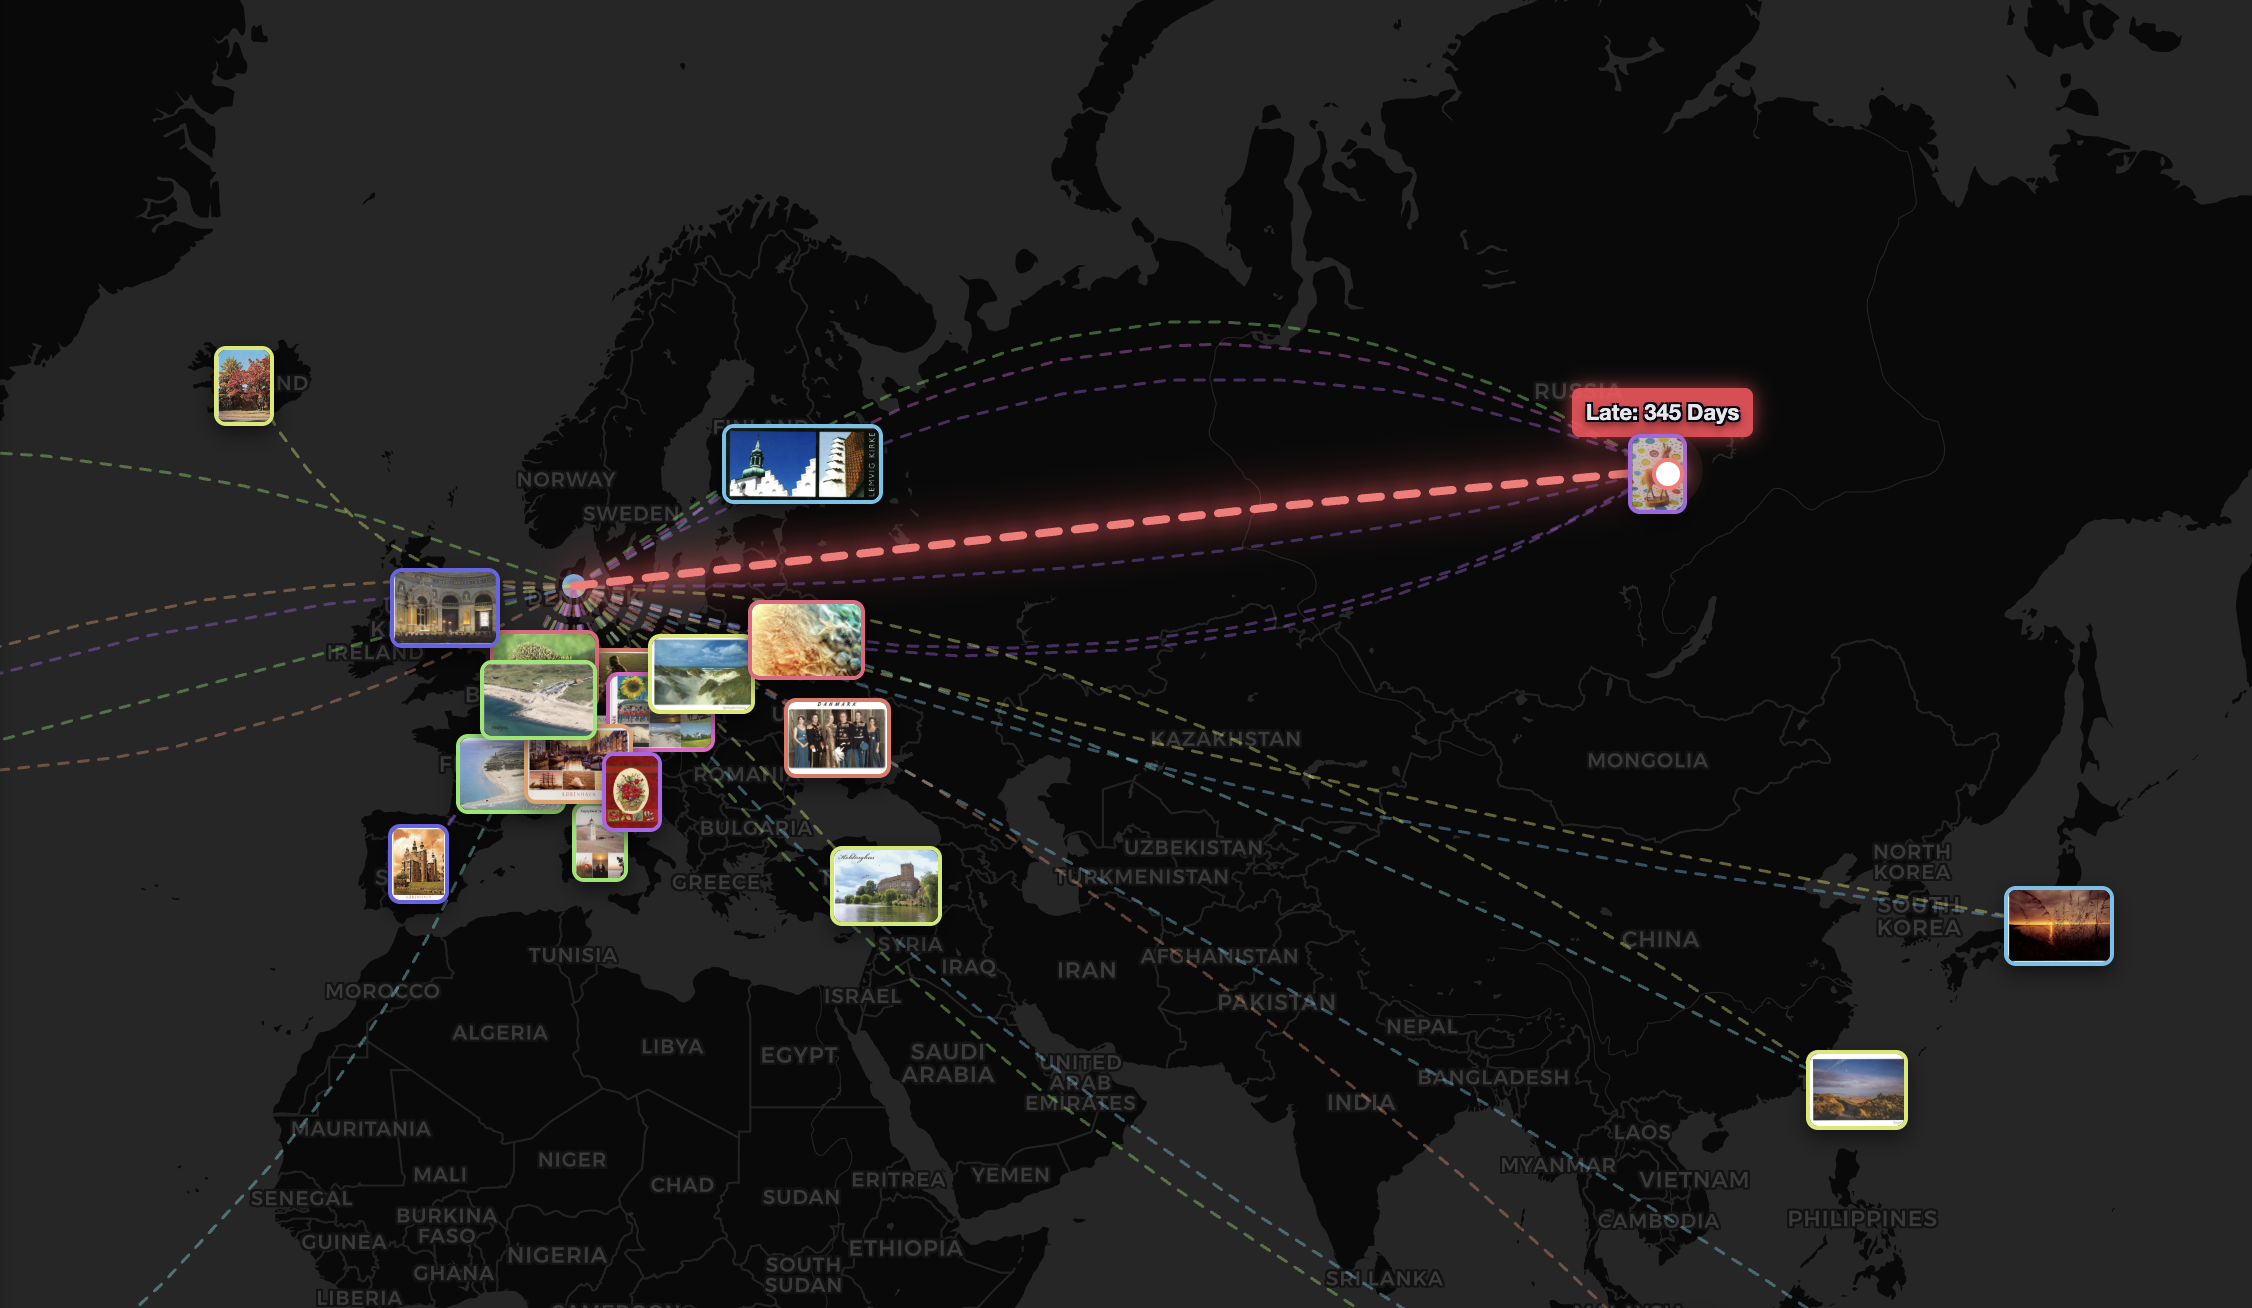
M3: Geographic Map
- Approach: Vector rendering with Leaflet.js. Node colors distinguish senders (Blue) from strict receivers (Red).
- Unique Solution: Replaced straight lines with randomized Bézier curves to solve edge-overlapping.
- Analysis Task: Preventing visual hairballs via curved paths and cluster-matched colors.
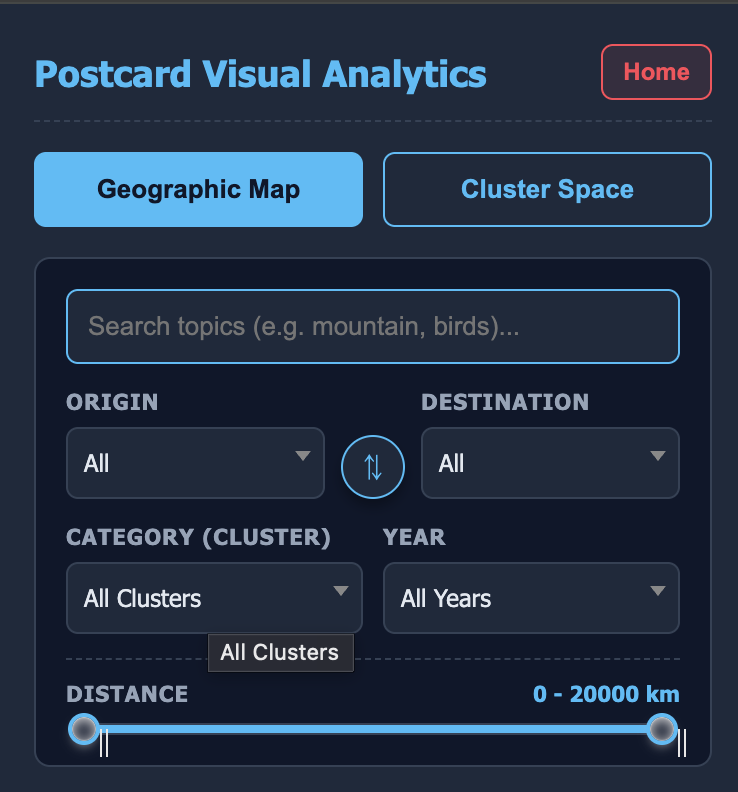
E1: Dynamic Search Function
- Approach: Real-time text search synced perfectly with multiple dropdown filters.
- Unique Solution: Deep linking. Searching updates the map, list, and clusters all at the exact same time.
- Analysis Task: Rapid deep-dive exploration of specific topics or destinations.
E2: Visualizing Outliers
- Approach: System sorts the delivery days on-the-fly to find the longest delayed postcard.
- Unique Solution: The Late Arrival Alarm. Highlights the longest path with a glowing CSS vector line.
- Interaction: Clicking the card launches a live-counting animated dot across the map.
E3: Semantic Zooming
- Approach: A visibility engine based on map zoom layers.
- Unique Solution: To prevent map clutter, image thumbnails are hidden at the global scale.
- Trigger: Images appear smoothly only when zoomed in close or if the filtered data is under 100 cards.
Demonstration
End-to-End system execution focusing on unique interactions.
Embed 1-2 Min Demo Video Here
Programming Stack
Data / ML Architecture
- Language: Python 3
- Environment: Google Colab (GPU)
- Algorithms: PyTorch (OpenAI CLIP), MiniSom, Scikit-learn (K-Means)
Frontend Architecture
- Language: Vanilla JavaScript, HTML5, CSS3
- Libraries: Leaflet.js, jQuery
- Plugins: Select2, noUiSlider
Task Distribution
| Team Member | Roles | Reqs |
|---|---|---|
| Md Istain Ahmed | Colab ML Pipeline, Map Engine, Outlier Algorithms | M1, M3, E2 |
| Emon Basher | Frontend UI/UX, Cluster Space, Semantic Labeling | M2, E3 |
| Samiul Islam Sami | Search Engine, Filter Integrations, Documentation | E1 |
Resources
- Libraries & Tools: OpenAI CLIP weights, MiniSom, Leaflet.js.
- Course Lectures (TU Graz):
- "Document and Cluster Visualization" (Applied for M2: SOM & Semantic Clustering)
- "Maps" (Applied for M3: Geospatial layouts and node mapping)
- "Data Navigation and Interactive Lenses" (Applied for E3: Semantic Zooming)